Isosurfaces#
Isosurface rendering extracts and displays the zero level-set of a scalar function inside a 3D mesh. A second function can be colored on the isosurface.
Isolines (contour lines) draw curves of constant value on surfaces and clipping planes, using screen-space derivatives for consistent line width.
Basic Isosurface#
Render the zero level-set of a function, colored by another function:
[1]:
from netgen.occ import *
from ngsolve import *
from ngsolve_webgpu.mesh import MeshData
from ngsolve_webgpu.cf import FunctionData
from ngsolve_webgpu.isosurface import IsoSurfaceRenderer, NegativeSurfaceRenderer, NegativeClippingRenderer
from webgpu.clipping import Clipping
from webgpu.colormap import Colorbar, Colormap
from webgpu.jupyter import Draw

box = Box((-1, -1, -1), (1, 1, 1))
mesh = Mesh(OCCGeometry(box).GenerateMesh(maxh=0.2))

gf = GridFunction(H1(mesh, order=2))
levelset = 0.8**2 - (x**2 + y**2 + z**2)
gf.Set(levelset)

mesh_data = MeshData(mesh)
colormap = Colormap()
clipping = Clipping()

func_data = FunctionData(mesh_data, x, order=2)
levelset_data = FunctionData(mesh_data, -gf, order=2)

iso = IsoSurfaceRenderer(func_data, levelset_data, clipping, colormap)
neg_surface = NegativeSurfaceRenderer(func_data, levelset_data, clipping=clipping, colormap=colormap)
neg_clip = NegativeClippingRenderer(func_data, levelset_data, clipping, colormap)

clipping.mode = clipping.Mode.PLANE
scene = Draw([iso, neg_clip, neg_surface, Colorbar(colormap)])
Warning: failed to init renderer IsoSurfaceRenderer: 'data_3d'
Warning: failed to init renderer NegativeClippingRenderer: 'data_3d'
Warning: failed to init renderer NegativeSurfaceRenderer: 'data_2d'


Three renderers work together:
``IsoSurfaceRenderer`` — extracts and renders the zero level-set surface via a compute shader. The level-set data is negated by convention (negative = inside).
``NegativeSurfaceRenderer`` — renders the outer mesh surface only where the level-set is negative (inside the domain).
``NegativeClippingRenderer`` — renders the clipping cross-section only inside the level-set domain.
Updating the Level Set#
The isosurface updates when the underlying GridFunction changes and scene.redraw() is called.
[2]:
gf.Set(0.5**2 - (x**2 + y**2 + z**2))
scene.redraw()
Isolines#
Isolines (contour lines) show where a function takes specific values. They are drawn directly in the fragment shader using screen-space derivatives for consistent line width at any zoom level.
IsolineRendereris a subclass ofCFRendererthat adds isoline rendering.ClippingIsolineRendererdoes the same on a clipping plane cross-section.show_field=Truerenders the colored field with isolines;show_field=False(default) renders only the lines.
The simplest way to add isolines: pass isolines=True or a number of levels to Draw.
[3]:
from ngsolve import *
from ngsolve_webgpu import *
from ngsolve_webgpu.jupyter import Draw
mesh = Mesh(unit_square.GenerateMesh(maxh=0.05))
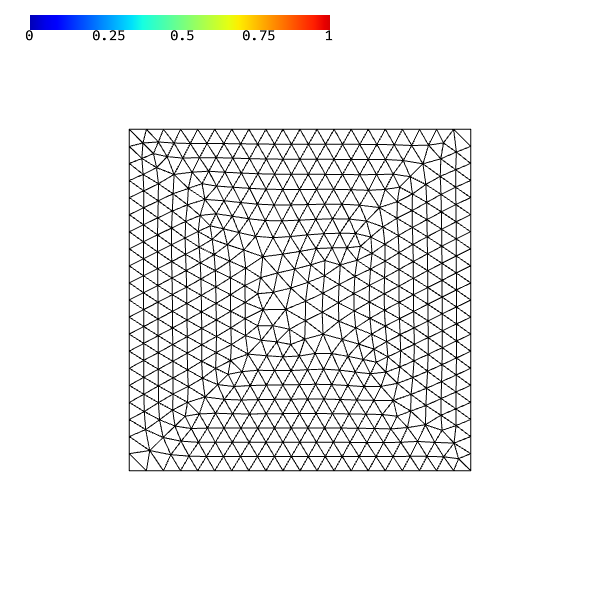
Draw(sin(10*x)*cos(10*y), mesh, order=4, isolines=10)
[3]:
For more control, create an IsolineRenderer directly. It is a subclass of CFRenderer that adds isoline rendering. Use show_field=True to also show the colored field underneath.
[4]:
from ngsolve import *
from ngsolve_webgpu import *
from webgpu.jupyter import Draw
mesh = Mesh(unit_square.GenerateMesh(maxh=0.05))
mesh_data = MeshData(mesh)
cf = exp(-(10*((x-0.5)**2 + (y-0.5)**2)))
function_data = FunctionData(mesh_data, cf, order=4)
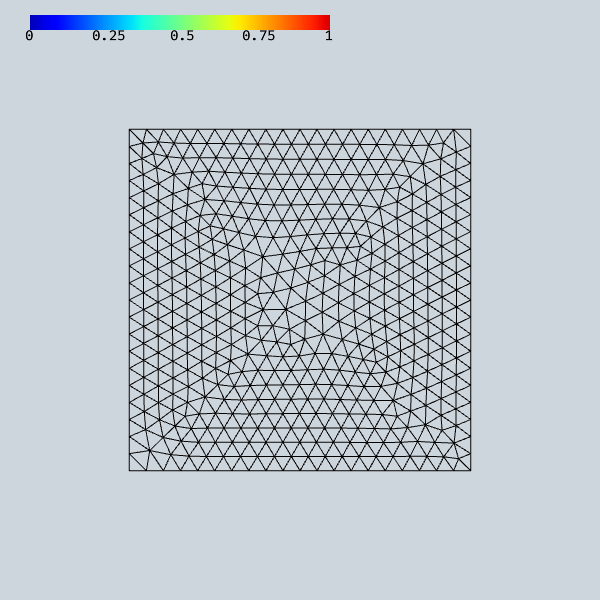
renderer = IsolineRenderer(function_data, n_lines=12, thickness=2.0, show_field=True)
scene = Draw([renderer, Colorbar(renderer.colormap)])


[5]:
renderer.isolines.n_lines = 25
renderer.isolines.color = (1, 0, 0, 1)
scene.redraw()
IsolineRenderer draws only the isoline pixels and discards everything else, so it can be layered over a different visualization. This lets you show the isolines of one function on top of the color field of another.
[6]:
from ngsolve import *
from ngsolve_webgpu import *
from webgpu.jupyter import Draw

mesh = Mesh(unit_square.GenerateMesh(maxh=0.03))
mesh_data = MeshData(mesh)

temperature = FunctionData(mesh_data, sin(3*x)*cos(3*y), order=4)
pressure = FunctionData(mesh_data, exp(-5*((x-0.3)**2 + (y-0.7)**2)), order=4)

colormap = Colormap()
r_field = CFRenderer(temperature, colormap=colormap)
r_iso = IsolineRenderer(pressure, n_lines=12, thickness=1)

Draw([r_field, r_iso, Colorbar(colormap)])
[6]:
Isolines also work on clipping plane cross-sections. Use ClippingIsolineRenderer to overlay isolines of a function on the clip plane.
[7]:
from ngsolve import *
from ngsolve_webgpu import *
from webgpu.clipping import Clipping
from webgpu.jupyter import Draw

mesh = Mesh(unit_cube.GenerateMesh(maxh=0.1))
mesh_data = MeshData(mesh)
cf = sin(5*x)*cos(5*y)*exp(z)
function_data = FunctionData(mesh_data, cf, order=3)

clipping = Clipping()
clipping.mode = clipping.Mode.PLANE
clipping.center = [0.5, 0.5, 0.5]

colormap = Colormap()
clip_iso = ClippingIsolineRenderer(function_data, clipping=clipping, colormap=colormap, n_lines=10, show_field=True)
cfr = IsolineRenderer(function_data, n_lines=10, show_field=True, clipping=clipping, colormap=colormap)

Draw([cfr, clip_iso, Colorbar(colormap)])


[7]:
Property |
Description |
|---|---|
|
Number of evenly-spaced levels between colormap min and max |
|
Line width in approximate pixels (default 1.5) |
|
RGBA tuple for the line color (default black) |
|
Whether to also render the colored field (default False) |
[ ]: