Parametric Sine Wave#
In this tutorial we will create a simple parametric sine wave using Plotly. This example demonstrates how to use ngapp’s interactive components to create a dynamic visualization.
First, we create a new app, following the steps in the Getting Started tutorial.
Then, we import the necessary libraries and components
import numpy as np
from ngapp.app import App
from ngapp.components import Heading, NumberInput, Row, Centered, PlotlyComponent
Create a title for the app using the Heading component
self.title = Heading("Parametric Sine")
Next, we create a NumberInput component with initial values to allow users to adjust the frequency, amplitude, phase, and number of evaluation points of the sine wave.
self.amplitude = NumberInput(
    ui_label="Amplitude",
    ui_model_value=2,
)
self.phase = NumberInput(
    ui_label="Phase",
    ui_model_value=0,
)
self.frequency = NumberInput(
    ui_label="Frequency",
    ui_model_value=5,
)
self.nr_points = NumberInput(
    ui_label="Nr Points",
    ui_model_value=500,
)
and a plotly component to display the sine wave
self.plot = PlotlyComponent()
We then arrange the components in a layout using Row and Centered components
self.component = Centered(
    self.title,
    Row(self.amplitude, self.phase, self.frequency, self.nr_points),
    Row(self.plot),
)
It is important to set the layout of the app to the component we just created, otherwise it will not be displayed. Now we define a method to calculate the sine wave based on the input parameters
def draw(self):
    import plotly.graph_objects as go

    frequency = self.frequency.ui_model_value
    phase = self.phase.ui_model_value
    amplitude = self.amplitude.ui_model_value
    nr_points = self.nr_points.ui_model_value
    x = np.linspace(0, 1, int(nr_points))
    y = amplitude * np.sin(2 * np.pi * frequency * x + phase)
    fig = go.Figure()
    fig.add_trace(go.Scatter(x=x, y=y, mode="lines"))
    fig.update_layout(
        title=f"Sine Wave f={frequency}, phi={phase}, A={amplitude}",
        xaxis_title="x",
        yaxis_title="Amplitude",
    )
    self.plot.draw(fig)
Note that we can create a plotly figure as usual, and then pass it to the plotly component using the draw method.
Finally, we need to ensure that the draw method is called whenever any of the input parameters change. This is done by adding the draw method as a callback to the on_update_model_value event of each NumberInput component.
self.amplitude.on_update_model_value(self.draw)
self.phase.on_update_model_value(self.draw)
self.frequency.on_update_model_value(self.draw)
self.nr_points.on_update_model_value(self.draw)
Furthermore, to display the initial sine wave when the app loads, we call the draw method once the plotly component is mounted on the page.
self.plot.on_mounted(self.draw)
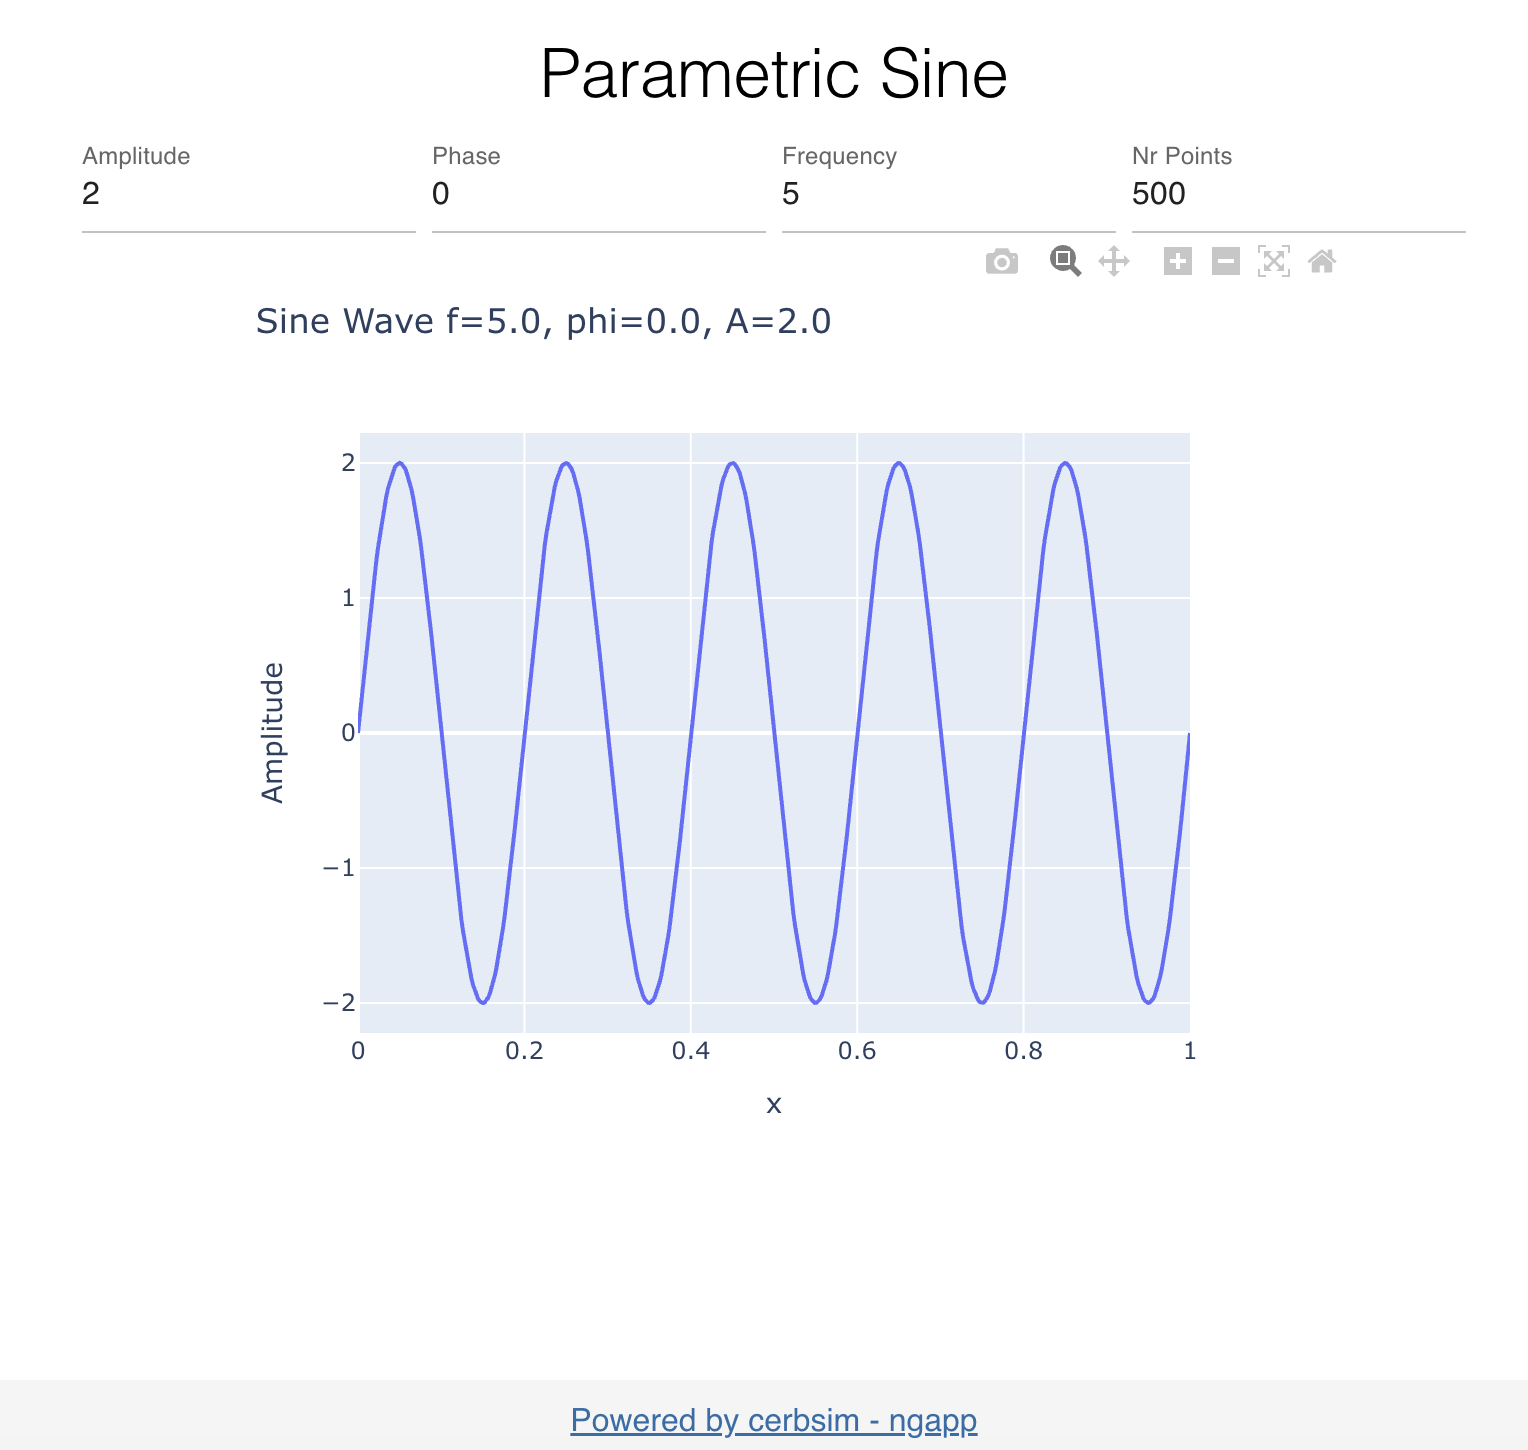
Final State#
The final state of the app should look like this:
The full code can be found in parametric_sine .